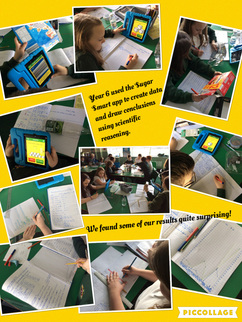
Year 6 used the Change 4 Life Sugar Smart app to discover how much sugar, per 100g, different foods contain. We plotted our findings onto line graphs and bar charts. Next, we recorded how much fat the same foods contained and added the results to the same graphs/charts. We were then able to draw conclusions from our data. We were surprised by our findings that, generally, the foods containing the least amount of sugar had a high fat content and vice versa.
 RSS Feed
